We use cookies to provide you with the best possible experience in your interactions with YOKOHAMA and on our web site. Please find out more about our use of Cookies here. By closing this banner, scrolling down this page or clicking on any element on the page you accept the use of cookies.
Activities to create our own forests at domestic and overseas sites to become a top-level environmentally friendly company
Scope of the Program
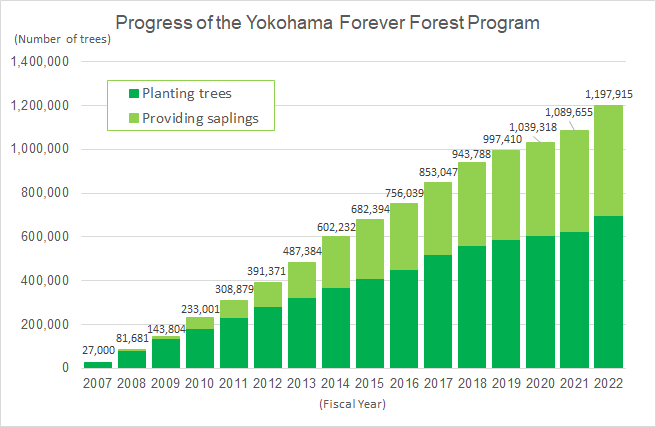
"YOKOHAMA Forever Forest" commenced in 2007 as a project to make good use of potential natural vegetation and plant 500,000 saplings at sites related to production and sales in Japan and abroad by 2017, the 100th anniversary of Yokohama Rubber.
Starting with tree planting at the Hiratsuka Factory on November 11 in 2007, the project was carried out at sites in Japan and overseas and the goal of planting 500,000 saplings was achieved in September 2017.
Making good use of the knowledge we have cultivated, we will continue to work on this initiative by providing saplings and know-how on tree planting as well as actually planting trees at our factories and other locations, with the aim of continuing to contribute to the conservation of regional biodiversity.
By the end of 2022, we had planted 699,000 trees and provided 499,000 saplings at 14 sites in Japan and 22 sites in eight foreign countries, making a total of 1,198,000 trees that had been planted. We will continue to promote this program at sites in Japan and overseas with a goal of planting a total of 1.3 million trees to have been planted and provided by 2030.
First tree-planting ceremony at Hiratsuka Factory in November 2007
Number of trees planted
Click names of plants to see activities progress at each plant.
Move the screen to the left or right to see the table information
2008~2018
2019
2020
2021
2022
Tree planting date
Mar 16, Mar 18
Apr 1
Number of trees planted
24,129
100
30
Number of participants
2,924
6
3
Planting area (m2)
4,611
55
45
Home-grown seedlings rate (%)
100
100
Total number of trees planted
24,129
24,129
24,229
24,229
24,259
Total number of participants
2,924
2,924
2,930
2,930
2,933
Number of saplings provided to the outside
12,204
185
30
20
0
Move the screen to the left or right to see the table information
2008~2018
2019
2020
2021
2022
Tree planting date
Jun 12
Number of trees planted
12,875
100
Number of participants
12,875
100
Planting area (m2)
2,755
600
Home-grown seedlings rate (%)
100
Total number of trees planted
12,875
12,975
12,975
12,975
12,975
Total number of participants
886
890
890
890
890
Number of saplings provided to the outside
35,952
1,171
687
745
362
Move the screen to the left or right to see the table information
2011~2018
2019
2020
2021
2022
Tree planting date
Number of trees planted
5,829
Number of participants
440
Planting area (m2)
856
Home-grown seedlings rate (%)
Total number of trees planted
5,829
5,829
5,829
5,829
5,829
Total number of participants
440
440
440
440
440
Number of saplings provided to the outside
15,226
1,315
603
1,144
1,117
Move the screen to the left or right to see the table information
2012~2018
2019
2020
2021
2022
Tree planting date
Number of trees planted
6,196
Number of participants
215
Planting area (m2)
1,683
Home-grown seedlings rate (%)
Total number of trees planted
6,196
6,196
6,196
6,196
6,196
Total number of participants
215
215
215
215
215
Number of saplings provided to the outside
0
0
0
0
0
Move the screen to the left or right to see the table information
2007~2018
2019
2020
2021
2022
Tree planting date
Apr 7, May 20, Nov21
Number of trees planted
33,579
202
Number of participants
4,401
31
Planting area (m2)
7,465
60
Home-grown seedlings rate (%)
100
Total number of trees planted
33,579
33,579
33,579
33,579
33,781
Total number of participants
4,401
4,401
4,401
4,401
4,432
Number of saplings provided to the outside
54,925
2,882
1,330
345
1,273
Move the screen to the left or right to see the table information
2008~2016
2017
2018
2019
2020
Tree planting date
-
Number of trees planted
2,131
Number of participants
358
Planting area (m2)
432
Home-grown seedlings rate (%)
-
Total number of trees planted
2,131
2,131
2,131
2,131
2,131
Total number of participants
358
358
358
358
358
Number of saplings provided to the outside
0
0
0
0
1
Move the screen to the left or right to see the table information
2007~2016
2017
2018
2019
2020
Tree planting date
-
Oct 13
Number of trees planted
1,381
1
Number of participants
190
Planting area (m2)
384
Home-grown seedlings rate (%)
-
Total number of trees planted
1,381
1,382
1,382
1,382
1,382
Total number of participants
190
190
190
190
190
Number of saplings provided to the outside
0
0
0
0
0
Move the screen to the left or right to see the table information
2008~2018
2019
2020
2021
2022
Tree planting date
Apr 2, May 9, Jun 19 Sep 19, Dec 3, 6, 10
Apr 7
Apr 6, May 10
Apr 6, May 9
Number of trees planted
30,168
337
36
24
62
Number of participants
4,180
404
31
28
58
Planting area (m2)
5,767
72
5
5
13
Home-grown seedlings rate (%)
100
100
100
100
Total number of trees planted
30,168
30,505
30,541
30,565
30,627
Total number of participants
4,180
4,584
4,615
4,643
4,701
Number of saplings provided to the outside
6,846
337
7
121
639
Move the screen to the left or right to see the table information
2008~2018
2019
2020
2021
2022
Tree planting date
Jul 5, Sep1
Number of trees planted
29,567
480
Number of participants
3,072
5
Planting area (m2)
6,580
15
Home-grown seedlings rate (%)
100
Total number of trees planted
29,567
29,567
29,567
30,047
30,047
Total number of participants
3,072
3,072
3,072
3,077
3,077
Number of saplings provided to the outside
3,766
500
0
0
0
Move the screen to the left or right to see the table information
2008~2018
2019
2020
2021
2022
Tree planting date
Number of trees planted
6,905
Number of participants
845
Planting area (m2)
1,676
Home-grown seedlings rate (%)
Total number of trees planted
6,905
6,905
6,905
6,905
6,905
Total number of participants
845
845
845
845
845
Number of saplings provided to the outside
1,098
0
0
0
0
Move the screen to the left or right to see the table information
2008~2018
2019
2020
2021
2022
Tree planting date
Mar 21, Apr 10, 25, May 9, 22, 23
Number of trees planted
37,398
745
Number of participants
2,834
50
Planting area (m2)
6,548
Home-grown seedlings rate (%)
100
Total number of trees planted
37,398
38,143
38,143
38,143
38,143
Total number of participants
2,834
2,884
2,884
2,884
2,884
Number of saplings provided to the outside
171,689
12,521
9,008
12,549
9,946
Move the screen to the left or right to see the table information
2009~2018
2019
2020
2021
2022
Tree planting date
Number of trees planted
10,543
Number of participants
1,446
Planting area (m2)
2,067
Home-grown seedlings rate (%)
Total number of trees planted
10,543
10,543
10,543
10,543
10,543
Total number of participants
1,446
1,446
1,446
1,446
1,446
Number of saplings provided to the outside
Counted as a part of Shinshiro Plant
Counted as a part of Shinshiro Plant
Counted as a part of Shinshiro Plant
Counted as a part of Shinshiro Plant
Counted as a part of Shinshiro Plant
Move the screen to the left or right to see the table information
2009~2018
2019
2020
2021
2022
Tree planting date
Number of trees planted
12,000
Number of participants
709
Planting area (m2)
2,520
Home-grown seedlings rate (%)
Total number of trees planted
12,000
12,000
12,000
12,000
12,000
Total number of participants
709
709
709
709
709
Number of saplings provided to the outside
1,450
1,000
1,000
1,000
1,000
Move the screen to the left or right to see the table information
2010~2018
2019
2020
2021
2022
Tree planting date
Number of trees planted
782
Number of participants
190
Planting area (m2)
284
Home-grown seedlings rate (%)
Total number of trees planted
782
782
782
782
782
Total number of participants
190
190
190
190
190
Number of saplings provided to the outside
0
0
0
0
0
Move the screen to the left or right to see the table information
2008~2018
2019
2020
2021
2022
Tree planting date
Mar 12, Nov 5
Number of trees planted
25,260
120
Number of participants
3,005
50
Planting area (m2)
5,910
110
Home-grown seedlings rate (%)
100
Total number of trees planted
25,260
25,380
25,380
25,380
25,380
Total number of participants
3,005
3,055
3,055
3,055
3,055
Number of saplings provided to the outside
1,710
120
0
20
30
Move the screen to the left or right to see the table information
2009~2018
2019
2020
2021
2022
Tree planting date
Number of trees planted
10,880
Number of participants
816
Planting area (m2)
2,076
Home-grown seedlings rate (%)
Total number of trees planted
10,880
10,880
10,880
10,880
10,880
Total number of participants
816
816
816
816
816
Number of saplings provided to the outside
0
10
150
0
20
Move the screen to the left or right to see the table information
2011~2018
2019
2020
2021
2022
Tree planting date
Jul 19, 26
Jun 23, 29
Jun 21
Jun 9, Jun16
Number of trees planted
34,000
5,000
5,000
5,000
5,000
Number of participants
2,035
230
247
232
225
Planting area (m2)
7,015
600
600
600
600
Home-grown seedlings rate (%)
100
100
100
100
Total number of trees planted
34,000
39,000
44,000
49,000
54,000
Total number of participants
2,035
2,265
2,512
2,744
2,969
Number of saplings provided to the outside
15,425
5,645
5,059
15,912
14,140
Move the screen to the left or right to see the table information
2008~2018
2019
2020
2021
2022
Tree planting date
Nov 28
Dec 22
Dec 23
Dec 20
Number of trees planted
90,225
2,500
3,500
2,700
5,520
Number of participants
15,586
250
654
390
382
Planting area (m2)
13,587
320
557
335
690
Home-grown seedlings rate (%)
100
100
100
100
Total number of trees planted
90,225
92,725
96,225
98,925
104,445
Total number of participants
15,586
15,836
16,490
16,880
17,262
Number of saplings provided to the outside
22,110
0
100
1,100
5,500
Move the screen to the left or right to see the table information
2008~2018
2019
2020
2021
2022
Tree planting date
Jun 5, Oct 26, Dec 3
May 21, Jun 5, Oct 31
Jan 29, Jun 5, Nov 5
Jun 10, Dec 16
Number of trees planted
43,402
604
700
310
530
Number of participants
6,105
74
25
46
45
Planting area (m2)
15,850
363
335
356
815
Home-grown seedlings rate (%)
100
100
100
94
Total number of trees planted
43,402
44,006
44,706
45,016
45,546
Total number of participants
6,105
6,179
6,204
6,250
6,295
Number of saplings provided to the outside
13,348
300
85
35
215
Move the screen to the left or right to see the table information
2010~2018
2019
2020
2021
2022
Tree planting date
Number of trees planted
20,538
Number of participants
3,342
Planting area (m2)
18,125
Home-grown seedlings rate (%)
Total number of trees planted
20,538
20,538
20,538
20,538
20,538
Total number of participants
3,342
3,342
3,342
3,342
3,342
Number of saplings provided to the outside
3,735
723
50
0
500
Move the screen to the left or right to see the table information
2015~2018
2019
2020
2021
2022
Tree planting date
Nov 6
Number of trees planted
9,896
200
Number of participants
1,271
31
Planting area (m2)
2,230
135
Home-grown seedlings rate (%)
100
Total number of trees planted
9,896
10,096
10,096
10,096
10,096
Total number of participants
1,271
1,302
1,302
1,302
1,302
Number of saplings provided to the outside
1,800
0
0
10
100
Move the screen to the left or right to see the table information
2013~2018
2019
2020
2021
2022
Tree planting date
May 22
May 22
Number of trees planted
7,076
20
15
Number of participants
1,271
24
20
Planting area (m2)
1,911
20
20
Home-grown seedlings rate (%)
Total number of trees planted
7,076
7,096
7,096
7,111
7,111
Total number of participants
1,271
1,295
1,295
1,315
1,315
Number of saplings provided to the outside
150
0
0
0
0
Move the screen to the left or right to see the table information
2012~2018
2019
2020
2021
2022
Tree planting date
Oct 12
Nov 19
Nov 11, Nov18
Number of trees planted
18,129
1,100
225
450
Number of participants
1,168
200
26
46
Planting area (m2)
2,940
210
45
90
Home-grown seedlings rate (%)
100
100
100
Total number of trees planted
18,129
19,229
19,229
19,454
19,904
Total number of participants
1,168
1,368
1,368
1,394
1,440
Number of saplings provided to the outside
1,100
500
0
500
0
Move the screen to the left or right to see the table information
2012~2018
2019
2020
2021
2022
Tree planting date
Mar 28
Mar 12
Mar 3
Number of trees planted
2,140
200
180
50
Number of participants
419
40
100
60
Planting area (m2)
872
67
60
60
Home-grown seedlings rate (%)
100
17
0
Total number of trees planted
2,140
2,340
2,340
2,520
2,570
Total number of participants
419
459
459
559
619
Number of saplings provided to the outside
645
53
60
35
15
Move the screen to the left or right to see the table information
2012~2018
2019
2020
2021
2022
Tree planting date
Jun 14, Jul 26, Oct 31 Nov 29,Dec 27
Jul 24, Aug 28, Sep 25, Dec 24
Aug 27, Sep 3, 10, 17, 24 Oct 15, Dec 3, 17
Jul 15, Sep 1, Oct 21
Number of trees planted
36,802
5,250
1,400
2,940
2,350
Number of participants
1,618
318
99
97
78
Planting area (m2)
8,732
615
180
568
502
Home-grown seedlings rate (%)
100
100
100
100
Total number of trees planted
36,802
42,052
43,452
46,392
48,742
Total number of participants
1,618
1,936
2,035
2,132
2,210
Number of saplings provided to the outside
0
0
0
0
0
Move the screen to the left or right to see the table information
2012~2018
2019
2020
2021
2022
Tree planting date
Number of trees planted
150
Number of participants
21
Planting area (m2)
53
Home-grown seedlings rate (%)
Total number of trees planted
150
150
150
150
150
Total number of participants
21
21
21
21
21
Number of saplings provided to the outside
0
0
0
0
0
Move the screen to the left or right to see the table information
2010~2018
2019
2020
2021
2022
Tree planting date
Number of trees planted
4,200
Number of participants
304
Planting area (m2)
6,893
Home-grown seedlings rate (%)
Total number of trees planted
4,200
4,200
4,200
4,200
4,200
Total number of participants
304
304
304
304
304
Number of saplings provided to the outside
0
0
0
0
0
Move the screen to the left or right to see the table information
2011~2018
2019
2020
2021
2022
Tree planting date
Number of trees planted
625
Number of participants
65
Planting area (m2)
80
Home-grown seedlings rate (%)
Total number of trees planted
625
625
625
625
625
Total number of participants
65
65
65
65
65
Number of saplings provided to the outside
24
0
0
0
0
Move the screen to the left or right to see the table information
2015~2018
2019
2020
2021
2022
Tree planting date
Number of trees planted
9,800
Number of participants
509
Planting area (m2)
1,100
Home-grown seedlings rate (%)
Total number of trees planted
9,800
9,800
9,800
9,800
9,800
Total number of participants
509
509
509
509
509
Number of saplings provided to the outside
0
0
0
0
0
Move the screen to the left or right to see the table information
2016~2018
2019
2020
2021
2022
Tree planting date
Aug
Number of trees planted
4,439
540
Number of participants
809
123
Planting area (m2)
1,667
180
Home-grown seedlings rate (%)
85
Total number of trees planted
4,979
5,519
5,519
5,519
5,519
Total number of participants
809
932
932
932
932
Number of saplings provided to the outside
5,540
150
504
680
600
Move the screen to the left or right to see the table information
2018
2019
2020
2021
2022
Tree planting date
Nov 1
Nov 1
May 12
Number of trees planted
11,150
1,200
500
1,000
Number of participants
1,137
200
200
124
Planting area (m2)
5,820
200
100
200
Home-grown seedlings rate (%)
100
100
100
Total number of trees planted
11,150
12,350
12,850
12,850
12,850
Total number of participants
1,137
1,337
1,537
1,537
1,661
Number of saplings provided to the outside
60
0
0
0
0
Move the screen to the left or right to see the table information
2017~2018
2019
2020
2021
2022
Tree planting date
Sep 21
Number of trees planted
11,959
5,000
386
962
24,022
Number of participants
Planting area (m2)
Home-grown seedlings rate (%)
100
Total number of trees planted
16,486
21,486
21,872
22,834
46,856
Total number of participants
Number of saplings provided to the outside
470
100
0
100
100
Move the screen to the left or right to see the table information
2018
2019
2020
2021
2022
Tree planting date
Mar
Mar, Nov
Mar 18, Apr 8, Nov 30
Mar
Number of trees planted
200
380
145
250
Number of participants
20
40
57
19
Planting area (m2)
40
60
81
150
Home-grown seedlings rate (%)
100
100
100
12
Total number of trees planted
200
580
725
975
Total number of participants
20
60
117
136
Number of saplings provided to the outside
0
0
0
0
0
Move the screen to the left or right to see the table information
2018
2019
2020
2021
2022
Tree planting date
Oct 7
Number of trees planted
2,080
Number of participants
150
Planting area (m2)
91
Home-grown seedlings rate (%)
Total number of trees planted
2,080
2,080
2,080
2,080
2,080
Total number of participants
150
150
150
150
150
Number of saplings provided to the outside
0
0
0
0
0
Move the screen to the left or right to see the table information
2018
2019
2020
2021
2022
Tree planting date
Jan 18 , Nov 30
Jun 5
Mar 7, Jul 5
Apr 6, Apr 25
Apr 22
Number of trees planted
6,839
3,380
4,797
7,600
4,800
Number of participants
1,330
500
640
Planting area (m2)
691
364
728
Home-grown seedlings rate (%)
Total number of trees planted
6,839
10,219
15,016
22,616
27,416
Total number of participants
1,330
1,830
2,470
2,470
2,470
Number of saplings provided to the outside
0
150
0
1,500
1,350
Move the screen to the left or right to see the table information
2022
Tree planting date
Number of trees planted
30,148
Number of participants
Planting area (m2)
Home-grown seedlings rate (%)
Total number of trees planted
30,148
Total number of participants
Number of saplings provided to the outside
0
Purpose of Forever Forest Programs
Developing participants' environmental awareness
Participants in this project do everything on their own, from germinating saplings to tree-planting, and even to the nurturing of forests. The "realization" that participants gained by actually joining the activity help develop their environmental awareness.
Disaster prevention, and the formulation of environmental conservation forest
Since the broad-leaved evergreen trees selected for planting are less likely to be blown down by typhoons and also fire-resistant, they minimize damage from disasters such as earthquakes, typhoons, tsunamis, and fires, and their forests can also serve as evacuation areas for local residents. The know-how cultivated through Yokohama Forever Forest Program has been utilized in the project of building the "forest seawall" (tree-planting for the “Heisei no Mori” in Otsuchi Town), tsunami countermeasures beginning in 2012.
Contribution to decelerating global warming
The forests created at our Company’s production sites around the world planted with locally-indigenous trees absorb and fix CO2, contributing to curbing global warming
Conservation of biodiversity
Some of the forests at our sites created in the Forever Forest Program have more than 50 varieties of locally-indigenous tree species, and such forests themselves contribute to biodiversity conservation. These forests also create habitats for birds and insects, fostering rich biodiversity.
Tree planting at Yokohama Tire Manufacturing (Thailand) Co., Ltd.(YTMT)
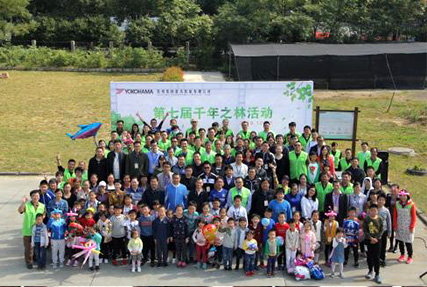
The 7th " Forever Forest" tree-planting ceremony at Suzhou Yokohama Tire Co., Ltd. (CSZY)
Features of Forever Forest Programs
Miyawaki method
Yokohama Rubber has been conducting tree-planting activities under the guidance of the late Akira Miyawaki, a plant ecologist and professor emeritus at Yokohama National University, who has been involved in forestation around the world. The "Miyazaki method" advocated by the late Prof. Miyazaki is different from ordinary afforestation in that it is a distinctive technique in which tree species and different types of saplings that are locally indigenous are grown and planted close together (mixed and dense planting) in arrangements closely resembling natural forests. This method has been employed both inside and outside of Japan to regenerate forests in many different places. It is said that it normally takes 100 years or longer to regenerate a forest; however, the Miyawaki method can regenerate a forest within 10 to 20 years, and after three years from planting, basically, it will become unnecessary to take care of the forest.
In addition, most of the tree species selected in this method are broad-leaved evergreen trees with deep and tap roots that do not easily fall down, creating a strong disaster-prevention forest protecting the environment around it from typhoons, earthquakes, tsunamis, fires, etc. Yokohama Rubber aims for harmonious coexistence with local communities by planting trees around factories of its production sites based on the Miyazaki method for the creation of "YOKOHAMA Forever Forest" having a role to play in minimizing damage in the event of disasters inside or outside of the factories.
Tree planting using the Miyawaki method at the Shinshiro Plant
Raising saplings by hand
Yokohama Rubber promotes the basic concept of preparing soil and raising saplings to create a forest by hand. Most of the process from preparing soil, collecting acorns to raising sapding in pots is done by employees, and currently 80% of the saplings are prepared by them. At each factory, employees get involved in most of the process including collecting acorns, sowing seeds and raising saplings, and grow nursery plants to be planted at their factory and provided for the local community.
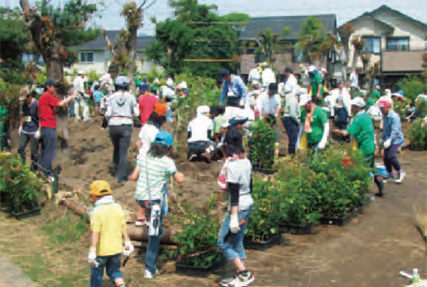
Tree planting by employees and local residents
This project being done at our sites around the world is supported by the efforts of employees, their families, and local residents who plant trees and take care of them after that. We hope that planting and nurturing trees together will create a sense of unity between our employees and people in local communities, contributing to an increase in trust from people within those communities. We also encourage people at municipal administrative agencies to take part in our project in order to secure further support for the tree-planting activity in each local community.
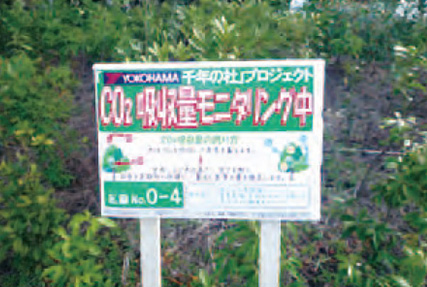
Measuring Effect of Tree Planting
Monitoring of the amount of CO2 absorbed and fixed and bird-watching are being conducted at the Hiratsuka Factory. Trees absorb CO2 in the atmosphere and fix it onto cell walls, etc. It is known that the amount of CO2 absorbed and fixed by a tree can be estimated by measuring the diameter of its tree trunk and height. The amount of CO2 stored by the trees has been monitored by measuring their diameter and height on a regular basis since April 2009.
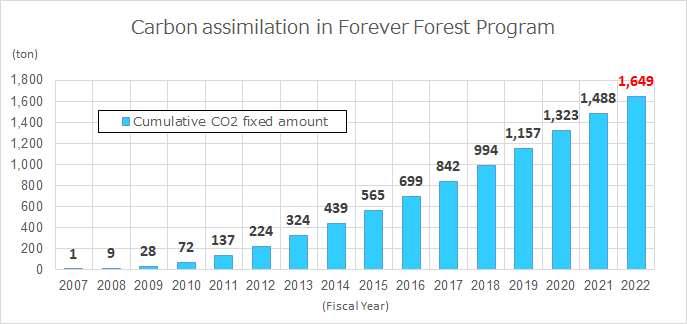
The total amount of CO2 absorbed and fixed by Yokohama Rubber's entire Forever Forest was estimated based on the results of the most recent growth survey (growth and survival rates of the planted trees) conducted in the Hiratsuka Factory.
The estimated result indicates that the trees of Yokohama Rubber's Forever Forest had absorbed and fixed a total of approximately 1,649 tons of CO2 by the end of 2022.
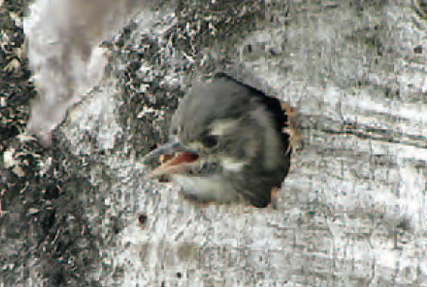
Additionally, the "bird-watching club" consisting of employees voluntarily gathered together takes the initiative in conducting bird-watching once a month from the standpoint of conservation of biodiversity under the guidance of members of "Komatan," the club holding bird-watching parties in Hiratsuka City and Oiso Town. Currently, with the number of wild bird species flying to the forest increasing to 61 as of the end of 2022 (12 species in September 2008, when they started bird-watching, and 55 species as of the end of 2017), employees and local people are continuing bird-watching while having fun.
Monitoring of CO₂ absorption
Bird watching
Carbon assimilation in Forever Forest Activities
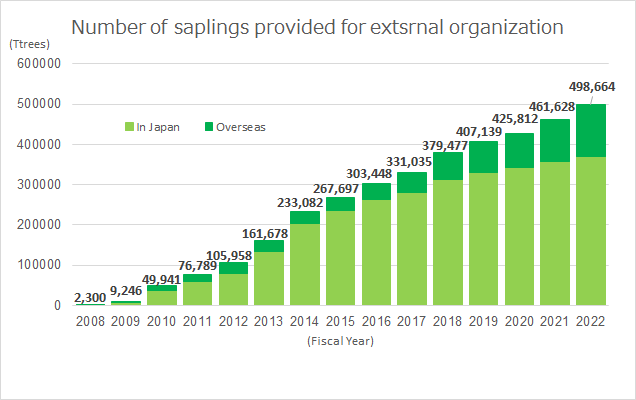
Sapling donation
We provide the saplings we have nurtured not only to our own factories for tree planting but also to a wide range of organizations including municipalities, schools, and other companies for free. In addition to providing saplings, we also teach elementary school students how to plant trees. The graph below shows the progress state of the Forever Forest project that has expanded within and outside our Company. The tree planted in the Heisei no Mori, Otsuchi Town, some of which were purchased, are included.
YOKOHAMA Forever Forest Programs in Numbers
699,251
The number of trees planted at our production and sales-related sites as part of YOKOHAMA Forever Forest tree plantings.
68,842
The number of people who had participated in tree-planting events by the end of 2022. Many people including our employees and their families, local residents join the events.
90
The number of different species of saplings that are planted at sites in Japan. Since saplings are selected to match the environment of the land at each site, different species of saplings are planted depending on the site, with some of which having as many as 68 species of nursery trees. YOKOHAMA Forever Forest Programs are characterized by the combination of tall trees such as Castanopsis sieboldii, Machilus thunbergii and Quercus (Japanese oak) and short trees.
36
The total number of sites in which tree planting had been conducted by the end of 2022 (14 sites in Japan, and 21 overseas). In addition to production sites, the tree-planting activity is expanding to our tire evaluation sites and group companies.
61
The number of different bird species that have been observed at the Hiratsuka Factory by the end of 2022.
498,664
The total number of saplings provided for external organizations by the end of 2022.